Wavelets are uncommon in machine learning, systems with learnable wavelets, in particular, are rare. Promising applications of wavelets in neural networks exist. Adaptive wavelets for network compression are explored in the new paper ‘Neural network compression via learnable wavelet transforms‘. By defining new wavelet loss terms based on the product filter approach to wavelet design, the wavelets become part of the network architecture. They can be learned just like any other weights. Source code implementing wavelet optimization in PyTorch is available on Github.
Jaxlets – Fast Wavelet Transformations in JAX
The fast wavelet transform is an important signal processing algorithm. Jet a differentiable implementation in JAX has been missing so far, I have therefore opened my implementation . It supports the one and two dimensional analysis and synthesis transforms. As well as an implementation of the forward wavelet packet transform. The plot below shows an analysis of a linear chirp signal using a Daubechies wavelet.
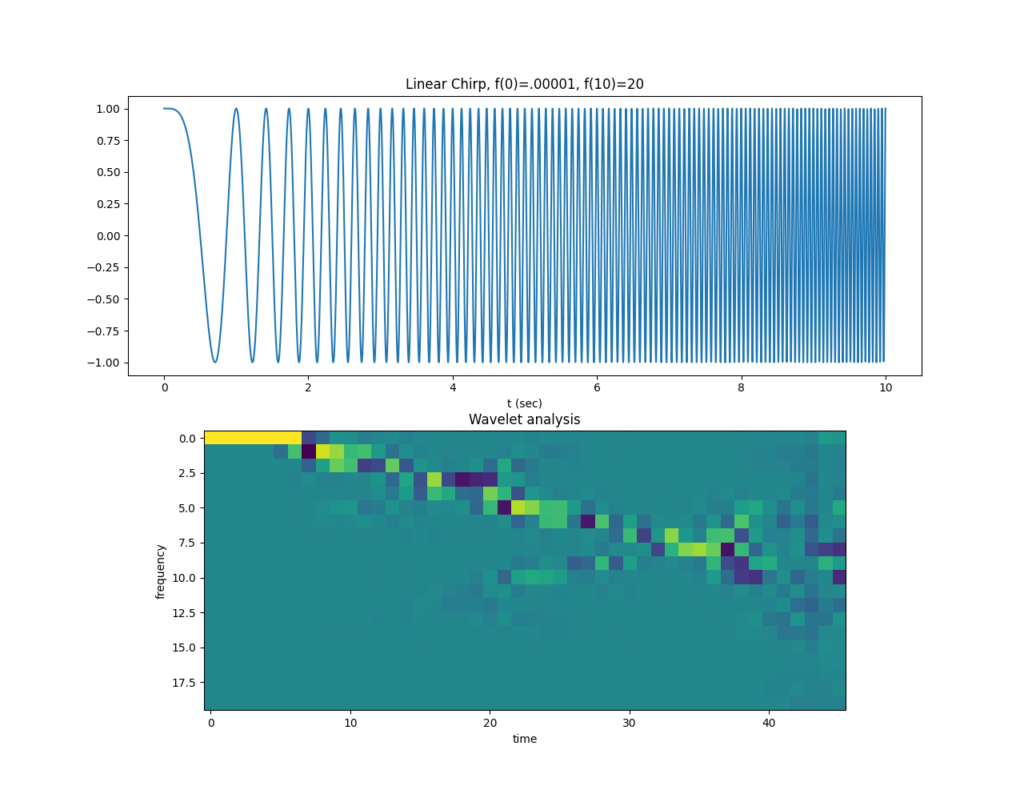
As the chirps’ frequency increases we see that the wavelet coefficients rise as well.
Source code is available at https://github.com/v0lta/jaxlets .
Video Prediction à la Fourier
Video frame prediction is a very challenging problem. Many recent neural network based solution-attempts trained using a mean squared error lead to blurry predictions. My most recent paper currently under review proposes to use Phase correlation and the Fourier-Shift theorem estimate changes and transform current images into predictions. A demo is shown below. The video shows ground truth (left), shift prediction (middle) and an off the shelf GRU prediction (right).
Source code is available on github .
A more detailed description is available in the paper .
Complex Recurrent Neural Nets
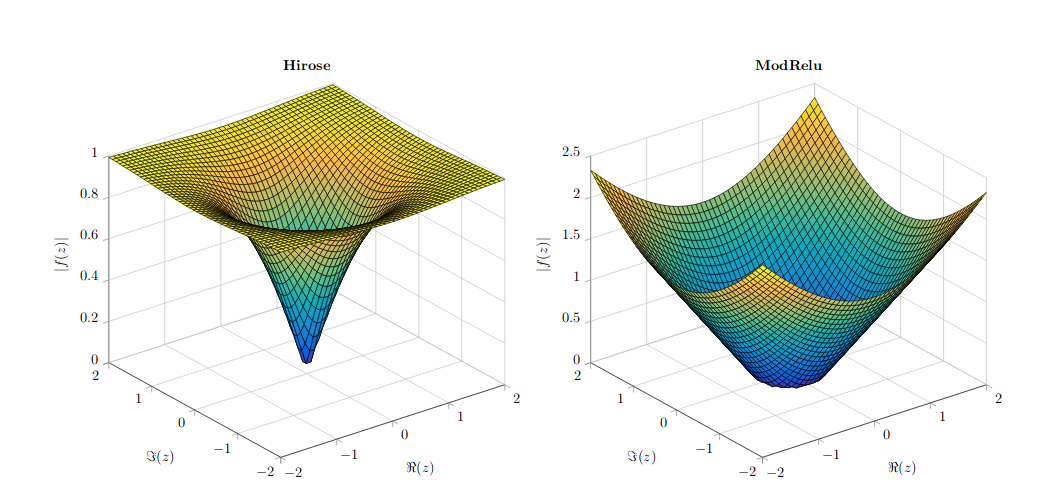
The paper Complex gated recurrent neural networks explores machine learning in the complex domain. For gradient descent to work the functions involved must be differentiable. In the complex domain holomorphic functions, which satisfy the Cauchy-Riemann partial differential equations are differentiable. Finding functions which fulfill this requirement and are useful for machine learning tasks is very difficult. In practice split differentiable complex functions are used which are real differentiable in the real and complex parts. This is true for the two most popular complex activation functions the ModRelu and the Hirose non-linearites shown below:
Modern RNNs rely on gating equations for memory management. Typically the gates produce values between zero and one, where one means that a value will be stored in the memory cell and zero that it will be removed. In the complex domain this behavior can be reproduced by using mappings from C to R, in particular a weighted average of the real and imaginary parts can be fed into a sigmoid non-linearity.
Using the split differentiable approach with a hirose activation and C to R gates its possible to define complex memory cells. The plot below tests their performance on the synthetic memory and adding benchmark problems.
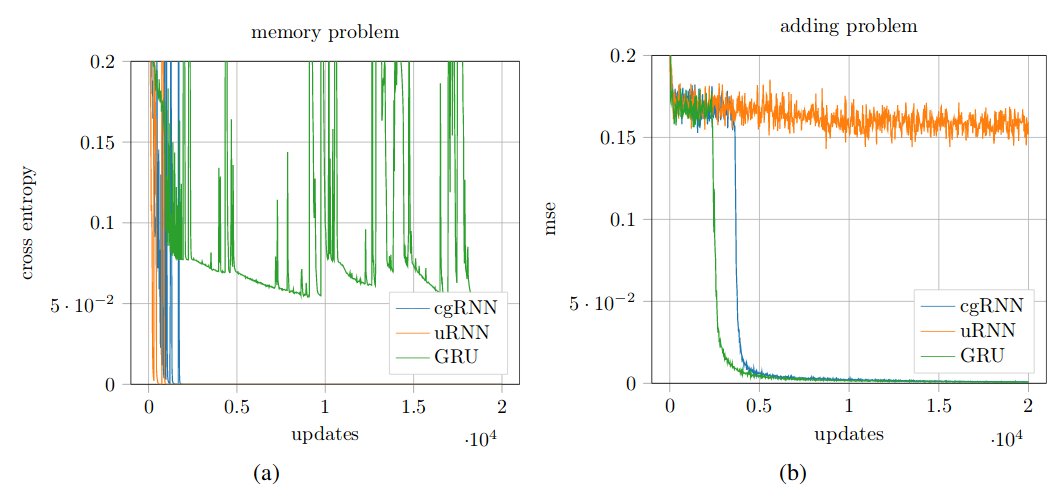
In short it can be observed that the complex gated cell can solve both the memory as well as the adding problem, when it combines the complex orthogonal structures from uRNNs with a gating mechanism similar to classic RNNs. For a more detailed discussion please take a look at the full paper
Below a complex memory unit solving the human motion prediction problem can be seen in action:
The code for this project is available on Github. I tested the complex memory cell on human motion data using a setting following this repository.
Spectral-RNN
Fourier methods have a long and proven track record as an excellent tool in data processing. Integrating Fourier methods into complex recurrent neural network architectures is therefore an important goal. I integrated the short-time Fourier transform into a recurrent (complex-valued) network structure. This helps when dealing with hard prediction tasks such as human motion prediction, a demo paper and code are available.
Control Engineering
My favorite control project thus far as been a quad-copter control project. The project consisted of three steps. In a first step a state space model for a quad-copter had to be found. After testing the model with some simple simulations, an LQR controller based in this model was designed. Secondly a small weight disturbance was added, which was counteracted by using integrators in the controller. Finally to reach more realistic scenarios Kalman-Filtering was included in the design. The plots below show the results of a simulated test flight:
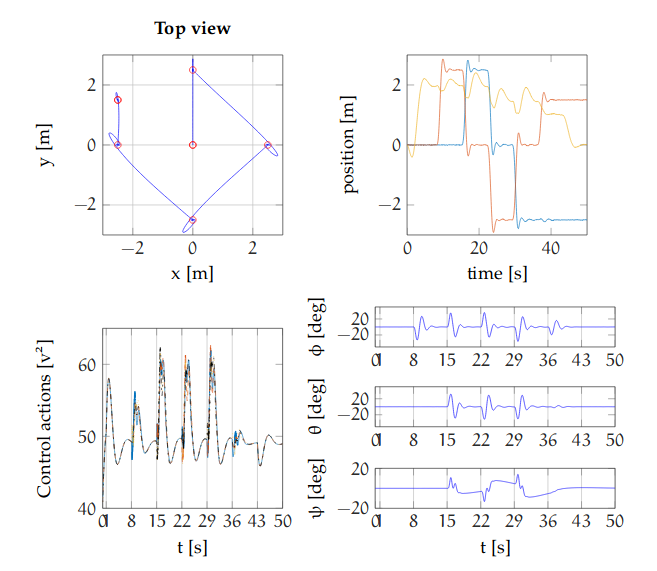
In the top left plot the red circles show checkpoints which the quad-copter had to reach as quickly as possible. The graphs below the position in x,y,z as well as control actions and the evolution of the quadcopter’s angles over time is shown. Overall it can be concluded, that the Simulink-LQR-Controller does its job.
Read more of my work on control:
Project report of my quadcopter control project
Bachelor thesis on pseudospectra in control [in German]
Listen, Attend and Spell
During my Master Thesis project I re-implemented Listen, attend and Spell, an attention based speech recognition system. A key problem in speech recognition is that often it is unknown what is said when. In other words the speech signal and its transcription is unaligned. Attention based system such as the one I wrote solve this problem by computing attention weights for each input vector. A visualization of the system is given below:
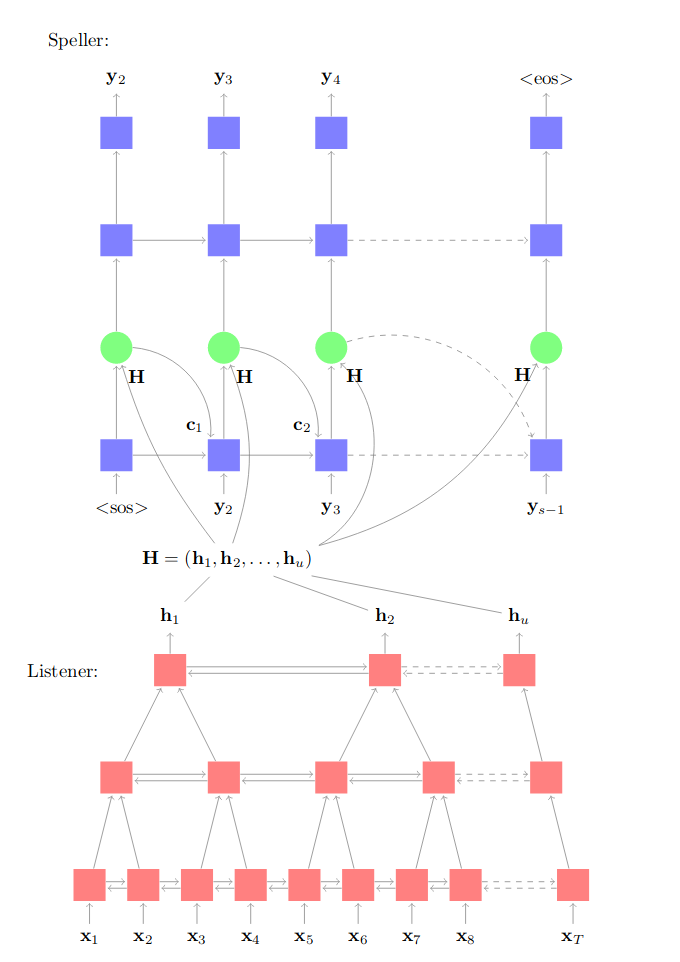
The overall system consists of the two blocks shown in the image above. A listener network computes a compressed fixed length encoding of an input signal. Which is then transcribed to an output sequence by the speller. To come up with a transcription the speller has to compute attention weights such as those shown below:
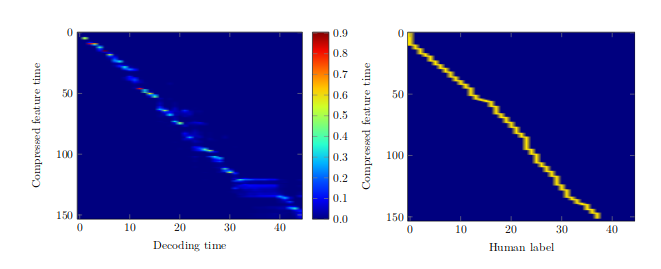
The plot above reveals that the attention weights found be the network are quite similar to those assigned by a human listener. Some artifacts remain, but its must be kept in mind that TIMIT is a quite small data set. Better results have been observed when larger data sets and more that just a single 8GB graphics card are used for training.
The source code is available on github.
For an in depth discussion please take a look at my thesis text.
The links below lead to more samples of my work on support vector machines and data-mining:
More on svms
More on data-mining
Medical Image Analysis
As coursework for my computer vision class in Leuven I looked into support vector machines on medical data. The task was to locate incisor teeth.
For every window the svm generates the probabilities for a miss and hit. In this example the frame with the largest hit probability was chosen, as all images where known to contain incisors somewhere.
The links below lead to more samples of my work on support vector machines and data-mining:
More on svms
More on data-mining
Linear Algebra
One of the most interesting things I have encountered in linear algebra are pseudospectra and their relation to toeplitz symbol functions, as well as their associated circulant matrix eigenvalues.
Below I have included plots which illustrate this beautiful relation (click to enlarge in new tab):
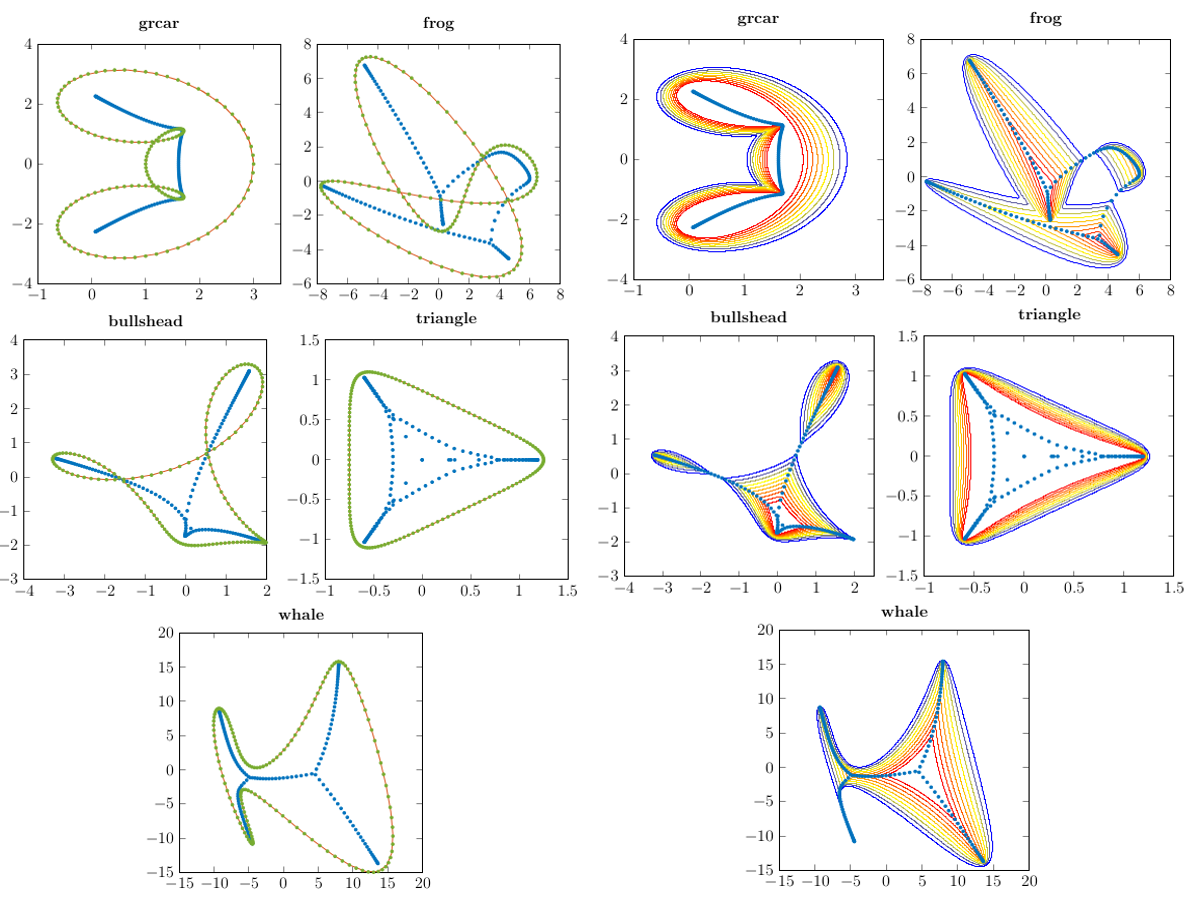
Shown on the left are the Symbol functions (yellow), Toeplitz eigenvalues (blue) and circulant matrix
eigenvalues (green). On the right epsilon-pseudospectra of the same matrices are shown.
Interested? More on:
Pseudospectra
Regularization
PDEs and iGem
One of the first equations I discretized and simulated was the wave equation using a finite difference scheme. I ended up with a simulation, which is quite pretty:
The biggest PDE project I have done so far was with the Leuven iGem-Team. We simulated the behavior of pattern forming bacteria using pure PDE and a PDE-Agent hybrid models. The pure PDE simulations have been generated by discretizing a modified Keller-Segel system of equations using a finite volume method in Matlab:
In order to take cell adhesion into account we created this hybrid model:
The international jury in Boston nominated us for the best model award, which means they saw us in the top 5 of overgrad teams in the modeling category.
Interested? Read more here:
Leuven iGem 2015 wiki